For most of its history, investor relations was a broadcast discipline: publish the announcement, send the EDM, hold the briefing, and hope the right people were listening. The problem was the hope. IR teams could measure what they sent, but rarely what landed.
That has changed. Modern investor relations platforms now capture engagement across every channel a listed company uses, and the teams that win are the ones turning that data into decisions. This guide covers the investor engagement metrics that actually matter in 2026 — and, just as importantly, how to make them useful.
Why engagement analytics matter now
Three forces have pushed engagement analytics from a nice-to-have to a board expectation. Retail and institutional investors now consume IR content across more channels than ever. Boards increasingly ask IR to prove impact, not just report activity. And the tooling has caught up — what once required three separate subscriptions and a spreadsheet is now consolidated in one place.
The result is a shift from "what did we publish?" to "who engaged, how deeply, and what should we do next?"
The metrics that actually matter
Engagement is not a single number. It is a picture assembled across five channels.
1. Email and EDM engagement
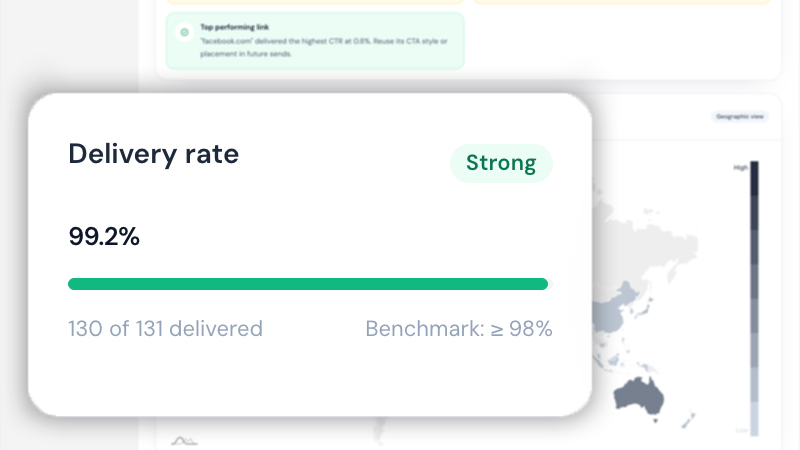
Open and click-through rates remain the front door of IR engagement. But the signal is in the detail: which links were clicked, by which segments, and how quickly. A 40% open rate on a results announcement tells you far less than knowing that your top 20 institutional contacts all clicked through to the investor presentation within an hour.
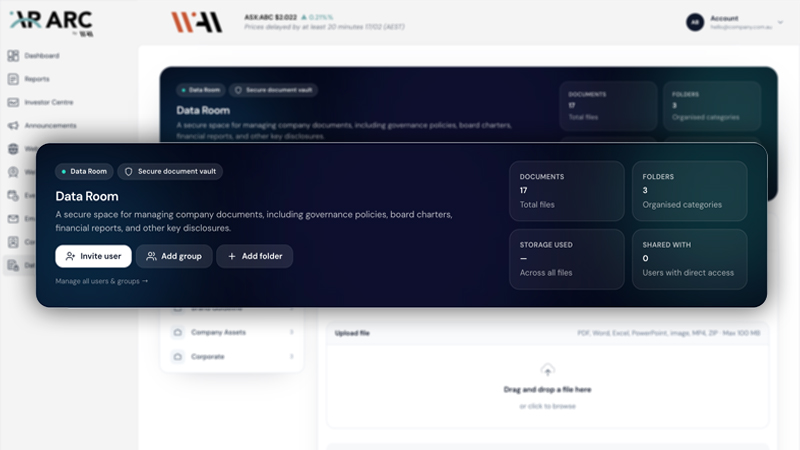
2. Document and data room activity
Time spent and pages viewed inside documents are among the most under-used signals in IR. When a prospective investor returns to your investor presentation three times and lingers on the cash-flow slides, that is intent. Engagement analytics inside a secure data room turn passive distribution into a live read on interest.
3. Website and investor centre behaviour
Session behaviour on your investor centre — pages visited, return visits, downloads — reveals what the market is researching about you. Spikes around announcements, AGMs, or capital events are early indicators of sentiment and scrutiny.
4. Events and webinar engagement
Registration, attendance, watch-time, and replay views show whether your narrative is holding attention. Replays matter as much as live attendance: a director who watches the results webinar twice is engaged differently from one who skims the deck.
5. Announcement and disclosure engagement
For ASX-listed companies, announcement reach and click behaviour close the loop between continuous disclosure and stakeholder attention — connecting what you are obliged to disclose with who actually engaged.
From metrics to stakeholder profiles
Here is the part most teams miss: individual metrics are noise until they are consolidated per stakeholder. An open here, a download there, a webinar replay next month — on their own, each is trivia. Stitched into a single timeline for each investor or contact, they become a profile you can act on.
A good stakeholder profile answers three questions at a glance: Is this contact engaging more or less over time? Which topics do they care about? And what is the next best action — a call, a tailored follow-up, an invitation? This is the same logic CRM brought to sales, applied to the capital markets relationship. Our companion guide on measuring investor engagement metrics walks through the channel-by-channel mechanics.
Make it board-ready
The ultimate test of engagement analytics is not the dashboard — it is the board pack. Directors do not want twelve charts; they want a narrative: engagement is up X% since the strategy update, driven by institutional interest in the growth segment, with these three stakeholders warranting direct follow-up.
If your analytics cannot produce that sentence, you are collecting data, not insight. Benchmarks help here too — comparing your engagement against peers turns an internal number into a market position. (Our ASX Engagement Benchmark exists for exactly this.)
Three common mistakes
- Chasing vanity metrics. A big email list with falling click rates is a warning sign, not a win.
- Never segmenting. Institutional, retail, broker, and media audiences behave differently; a single blended number hides the story.
- Leaving data in silos. Engagement insight lives in the connections between channels. Five disconnected tools cannot show you a stakeholder timeline.
Getting started
You do not need a data science team. Start by consolidating your channels into one platform, agree on the five-to-seven metrics that map to your IR objectives, and commit to one consolidated engagement view per stakeholder. Within a quarter you will be making outreach decisions from evidence rather than instinct — which is the entire point.
See ARC in action
Engagement analytics, secure data rooms, and AI co-pilots in one investor relations platform built for ASX-listed and pre-listing companies.
Book a demo